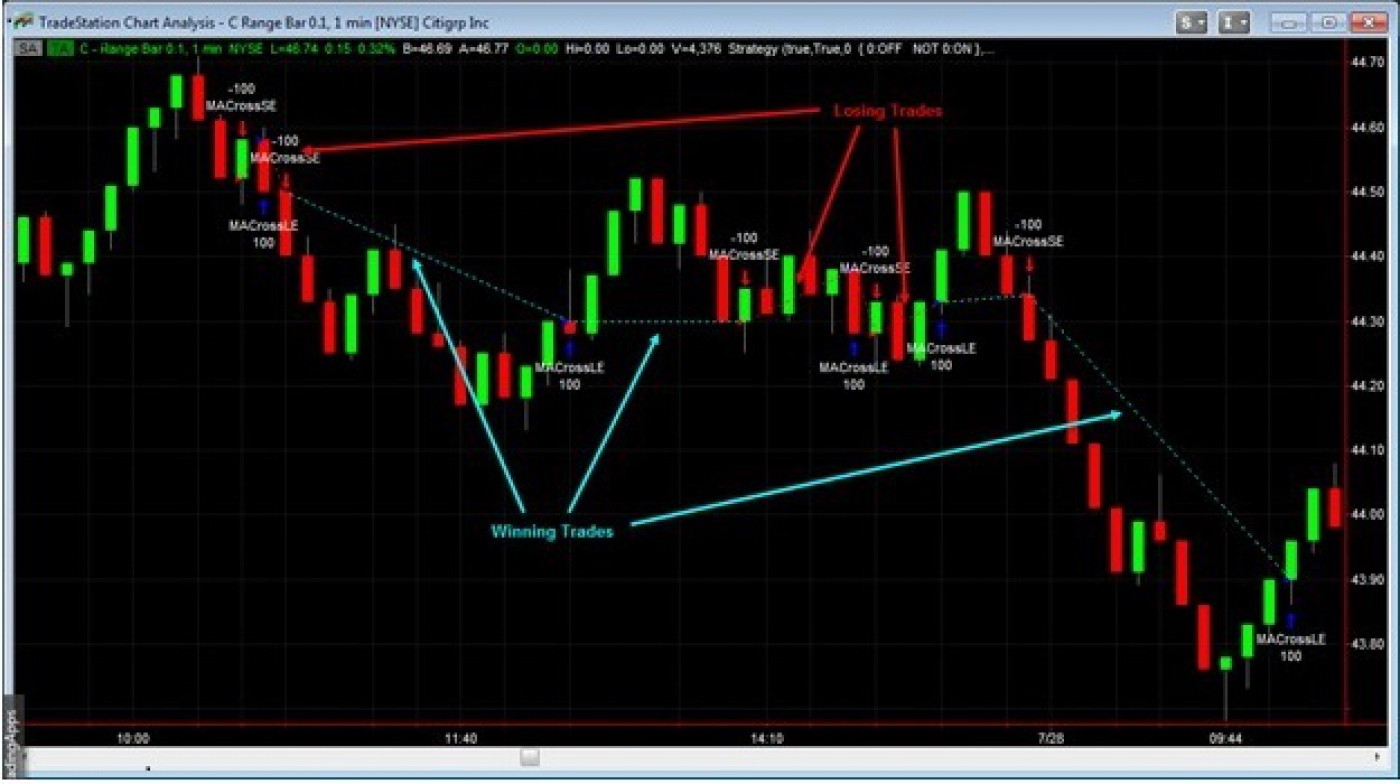
A Strategy Performance Report is also generated showing many statistics on the trades ( profitability, percent winners and losers, average trade profit/loss, etc. ), a trade list showing when each trade happened and the associated profit/loss, as well as many different graphs of the trading results. The big point is that you can see how well the strategy would have performed in the past. And this can be done in seconds versus spending days, weeks or months doing manual paper trades followed by very tedious data entry and analysis. You can rapidly test the strategy on many different symbols using different bar types and bar intervals going back years in history.
Once the strategy is verified as working correctly using historical data, TradeStation allows the strategy to be switched from back-testing history, to live trading in a matter of seconds with several mouse clicks. And TradeStation allows you to first test the strategy in live trading in the Simulated Mode, where you will see the trades occur in real-time, but do not purchase actual securities


